Create a Stacked bar graph with same height
Introduction
We have already covered creating basic stacked bar graphs here.
If we want to create stacked bar chart with same height then we will use the position=”fill” argument in geom_bar(..) function.
Procedure
We will be working with the ggplot2::diamonds dataset, few rows of the data are:
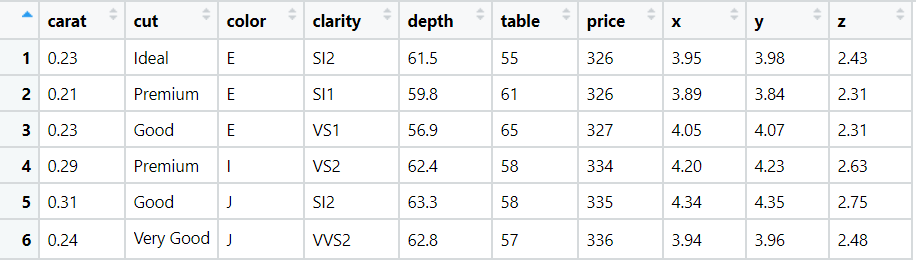
We will create bar graph which shows the count for each category of diamond cut and create stacks based on clarity of diamond.
Code
library(ggplot2)
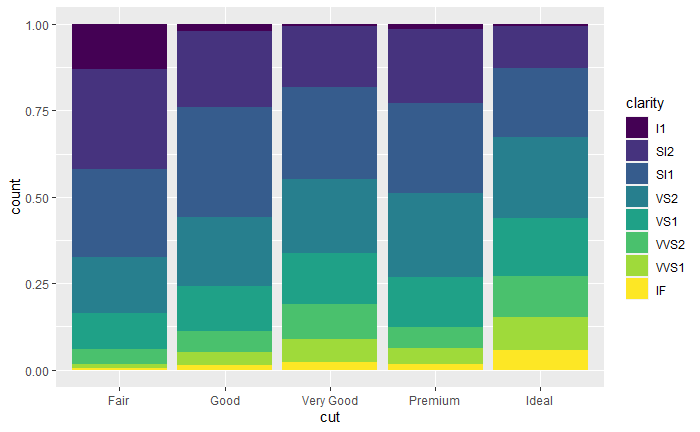
# stack based on clarity with same height
ggplot(data = diamonds) + geom_bar(mapping = aes(x = cut, fill = clarity), position="fill")And the output of above code is:
Conclusion
Thus we have successfully created stacked bar chart with same height.
References
- https://r4ds.had.co.nz/